
TheLakeLife · May 2026 · Lake Michigan Shoreline Market · Southwest Michigan
Pent-Up Demand, a Shrinking Shore
The overall Lake Michigan shoreline market dipped 2.67% in unit sales, but the headline misleads. True waterfront gained 6.45%, the combined $2M+ tier surged 79%, and waterfront inventory under one million dollars has nearly disappeared as prime season arrives.
Where the Market Stands
The Southwest Michigan Lake Michigan shoreline closed May 2026 with a trailing 12-month total of 255 closed sales, down from 262 a year ago. That is a 2.67% decline.¹ Read that number in a headline and you might think the Lake Michigan market is softening. It is not. The top-line figure is being pulled down by water-access properties, and it does not reflect what is happening on the shore itself.
Break the data by property type and the picture sharpens. True Lake Michigan waterfront properties closed 66 sales in the trailing 12 months, up from 62. That is a 6.45% gain on the most sought-after real estate in Southwest Michigan, in a year when the broader market edged lower.¹ Water-access properties (lake-close but not on the shore) declined to 170 sales from 179, a 5.03% dip that explains the headline.¹
Total active inventory across all types stands at 81 listings as of May 31, 2026, with 39 pending contracts market-wide.¹ Of those 81 listings, only 22 are true Lake Michigan waterfront. The market is absorbing what it has. What it has is thin.
True Lake Michigan waterfront is not following the overall market lower. It is outperforming it. When there are only 22 active shoreline listings and buyers are waiting, that is not a softening market. That is a market running low on available shore.
The $2M+ Story: A Combined 79% Surge
The most dramatic movement in this dataset is at the top of the market. Combined $2M+ unit sales across all property types reached 43 closed transactions versus 24 the prior year. That is a 79% year-over-year gain.¹
The $3M+ segment leads the way. Total $3M+ sales reached 22 closed transactions, more than double the 10 from the prior year, a 120% increase.¹ On true waterfront alone, $3M+ sales rose from 8 to 15, an 87.5% gain, with absorption holding at a balanced 4.00 months. On water access, the $3M+ band went from 2 to 6 sales, a 200% jump, though a portion of the 3 active listings in that band include new and speculative construction that naturally carries a longer runway.¹
The $2M to $3M band contributed 21 sales versus 14 prior year, a 50% gain overall.¹ On water access specifically, $2M to $3M went from 4 to 11 sales, a 175% increase, one of the strongest single-band gains in the entire dataset.¹
These buyers have already decided they want Lake Michigan. They have the capital and the patience. When the right property comes to market at this level, they act. The trailing 12-month data confirms that cohort is here, buying at a pace this market has not seen before at these price points.
The Shore Under $1M: Almost Nothing Left
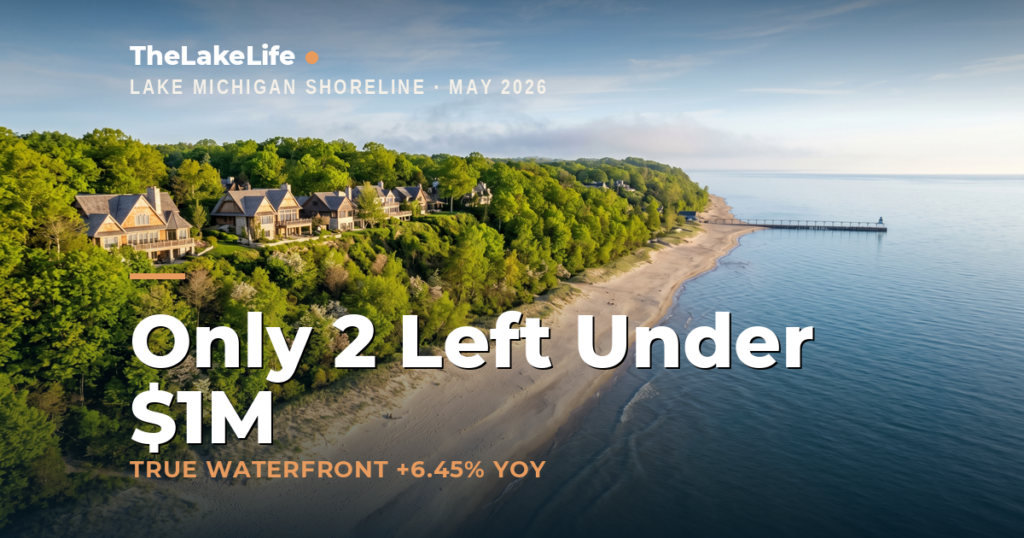
The most telling number in this report is the count of active true waterfront listings available under one million dollars: two. One listing at $500K to $749K. One listing at $750K to $999K.¹
The absorption rates explain why. The $750K to $999K waterfront band recorded 10 closed sales in the trailing 12 months against one active listing, translating to an absorption rate of 1.20 months, the tightest number in the entire dataset.¹ The $500K to $749K waterfront band is nearly identical: 8 closed, 1 active, 1.50 months of supply.¹
Year-over-year, unit sales at $750K to $999K waterfront rose 66.67%, from 6 to 10.¹ At $500K to $749K waterfront, sales doubled from 4 to 8.¹ The demand is not fading. The supply is gone. When a well-positioned property hits this range, it does not sit.
The entry-level waterfront segment under $500K is a different category. Most true Lake Michigan shoreline properties at this price point are condominiums and units in bluff-top or secondary-access settings where erosion considerations or land configuration affects value. Sales here fell from 14 to 11, down 21.43%, with absorption at 5.45 months.¹
“We’re finding fewer waterfront properties available in the lower range. You can’t find much under a million dollars on Lake Michigan right now. And if it is available or for sale, it’s probably gone right away, or it’s a high bluff setting where the land is worth a little bit less or there are some erosion considerations.” Drew Vinton, Lake Life Realty
The $1M to $2M Pullback: Seasonal, Not Structural
The one number that warrants context is the $1M to $2M waterfront segment. Closed sales fell from 21 to 12, a 42.86% decline, with absorption at 7.00 months.¹ That reads alarming. The pending count says otherwise.
As of May 31, 2026, there are 8 pending contracts in the $1M to $2M waterfront segment.¹ A year ago that number was near zero. Eight contracts waiting to close in a band that recorded 12 annual sales means a significant chunk of transactions are actively in the pipeline. Those closings will appear in June and July data.
On water access, $1M to $2M sales fell from 53 to 45, a 15.09% decline, but with 5 additional pending contracts queued.¹ Combined, the $1M to $2M range has 13 pending contracts heading into prime summer season.
The $1M to $2M pullback in closed sales reflects a delayed spring, not a retreating market. Contracts signed in late May close in June and July. The pending count already tells that story.
“To break it down to look at what’s driving everything, it’s waterfront properties. There have been twice as many properties going under contract waterfront than there were at this time last month. We went from six to twelve pending sales. Most of those are actually in the $1 to $2 million range. There is one over $2 million that went under contract within the past 30 days. There seems like a pent-up demand for waterfront properties, especially in that affordable range.” Drew Vinton, Lake Life Realty
Market Detail by Segment and Price Band
Full trailing 12-month data as of May 31, 2026, compared to May 31, 2025. Sourced from Southwestern Michigan Association of REALTORS®.¹
| Price Band | Active | Pending | Sold T12 | Prior Sold | Absorption | YoY Sales |
|---|---|---|---|---|---|---|
| $3M+ | 5 | 1 | 15 | 8 | 4.00 mo. | +87.50% |
| $2M to $3M | 3 | 0 | 10 | 9 | 3.60 mo. | +11.11% |
| $1M to $2M | 7 | 8 | 12 | 21 | 7.00 mo. | −42.86% |
| $750K to $999K | 1 | 0 | 10 | 6 | 1.20 mo. | +66.67% |
| $500K to $749K | 1 | 1 | 8 | 4 | 1.50 mo. | +100.00% |
| $0 to $499K | 5 | 2 | 11 | 14 | 5.45 mo. | −21.43% |
| All Waterfront | 22 | 12 | 66 | 62 | 4.00 mo. | +6.45% |
| Price Band | Active | Pending | Sold T12 | Prior Sold | Absorption | YoY Sales |
|---|---|---|---|---|---|---|
| $3M+ | 3 | 0 | 6 | 2 | 6.00 mo. | +200.00% |
| $2M to $3M | 4 | 0 | 11 | 4 | 4.36 mo. | +175.00% |
| $1M to $2M | 17 | 5 | 45 | 53 | 4.53 mo. | −15.09% |
| $750K to $999K | 10 | 7 | 36 | 36 | 3.33 mo. | 0.00% |
| $500K to $749K | 9 | 8 | 42 | 45 | 2.57 mo. | −6.67% |
| $0 to $499K | 9 | 6 | 30 | 39 | 3.60 mo. | −23.08% |
| All Water Access | 52 | 26 | 170 | 179 | 3.67 mo. | −5.03% |
Absorption rate = active listings ÷ (trailing 12-month sold ÷ 12). Under 4 months = seller’s market; 4 to 6 months = balanced; over 6 months = buyer’s market.
Bar chart below shows waterfront absorption by price band. Green = seller’s market. Blue = balanced. Orange = buyer’s market.
Waterfront Absorption by Price BandWhat This Means for Buyers and Sellers
The Lake Michigan shoreline is not one market. It is six overlapping markets stacked by price, and the right move in one band is the wrong move in another.
On the Ground as Prime Season Arrives
The trailing 12-month data is a rearview mirror. What is happening right now is moving faster than the report captures.
Consistently warm weather arrived in Southwest Michigan roughly a week before this interview. For weeks before that, the season had started slowly. Then the temperature shifted and so did buyer activity. In the 20 days between the May 11 snapshot and the May 31 report date, total pending contracts climbed from roughly 30 to 39. Waterfront pendings specifically doubled from six to twelve.
That acceleration is the most meaningful read on where the market is headed. The trailing 12-month sales data reflects what already closed. The pending count reflects what buyers are doing right now. And right now, buyers are committing to waterfront properties at the highest May pending pace in recent memory.
The inventory constraint on this market is structural, not seasonal. The pandemic compressed years of buyer demand into a short window and removed properties from circulation that might have otherwise returned to market in 2022 or 2023. Many of those properties are still held. They will come back, on the seller’s timeline, not the market’s. Until they do, supply on the shore stays thin and competition among buyers stays real.
“In second home, it’s typically always about lifestyle change, whether that’s the kids have stopped using it, the grandkids have stopped using it, they’re just not getting the use out of it that they used to anymore. It’s less about needing to move or get capital out. We’re still dealing with low unit counts from the fact that the pandemic ate up half of the inventory and there’s still that tail-whip effect. But unit prices are double since then. So the volume’s up, but the unit count is down.” Matt DeLano, Lake Life Realty
For buyers: prime season is here and the window is real. Inventory will continue to come online, but so will competition for it. If you have been watching the Lake Michigan market and waiting, the time to engage is now. The same property that was available in a slower spring will have more eyes on it as June and July arrive.
The Lake Life Advantage on Lake Michigan
When inventory is this tight and the price spread this wide, the brokerage you work with has a direct impact on the result. Lake Life Realty brings the transaction depth and local presence that this market demands.
The #1 Lake Brokerage by Volume and Market Share in Southwest Michigan
Since 2019, Lake Life Realty has held the highest market share for inland lake sales in Southwest Michigan. Paul DeLano founded the team with an exclusive focus on waterfront properties, closing more than 1,069 lake transactions since 2012. Drew Vinton leads Lake Michigan shoreline coverage, based in St. Joseph and serving communities from New Buffalo to South Haven. No generalist practice. No divided focus. Just lake property, done right.¹
Frequently Asked Questions
What does the overall 2.67% unit sales decline mean for the Lake Michigan market?
It means water-access properties pulled back slightly, which is enough to move the combined headline negative. True Lake Michigan waterfront told a different story: 66 closed sales versus 62 the prior year, a 6.45% gain.¹ If you are evaluating the shoreline market specifically, the headline understates what is actually happening on the water.
Why is true waterfront outperforming the overall market when inventory is this low?
Low inventory is a feature, not a constraint, when demand exceeds supply. With only 22 active waterfront listings and 66 closings in the trailing year, buyers are absorbing whatever becomes available.¹ Every well-priced waterfront listing draws competitive attention. That dynamic produces higher sales velocity and upward price pressure on properties that trade, not declining volume.
What drove the $3M+ segment to more than double in unit sales?
Accumulated demand met a growing supply of top-tier Lake Michigan shoreline properties. Total $3M+ sales reached 22 closed transactions versus 10 the prior year, a 120% increase.¹ On true waterfront, $3M+ sales rose 87.5%. Buyers at this level have the capital and conviction. When a property is priced to reflect the current market and positioned well on the shore, this buyer pool is active and willing to commit.
The $1M to $2M waterfront segment is down 42.86%. Is this a structural problem?
No. The leading indicator here is the pending count: 8 pending contracts in the $1M to $2M waterfront band as of May 31, 2026, compared to near zero a year ago.¹ Those contracts will close in June and July and will show up in the next trailing-period data. The trailing 12-month sales figure reflects a spring that started late, not a retreat in demand.
What does absorption of 1.20 months mean at the $750K to $999K waterfront level?
It means that at the current sales pace, the one active listing in that band would sell in approximately five to six weeks. A balanced market is four to six months. At 1.20 months, buyers have almost no window between a listing appearing and it going under contract.¹ Pre-approval, market knowledge, and the ability to move without extended contingency periods are not optional in this segment. They are the difference between securing a property and watching it close to someone else.
Why are Lake Michigan property owners holding on even as prices have roughly doubled since the pandemic?
The second-home market operates on a different logic. Sellers move when there is a lifestyle change, not a financial signal. And the inventory problem cuts both ways: if you sell, where do you go? Finding a comparable replacement on the shore is just as difficult as the property you are leaving.¹ Until the lifestyle trigger arrives, prices alone are not enough to bring Lake Michigan properties back to market.
Is there anything left on Lake Michigan under one million dollars?
Practically speaking, direct usable Lake Michigan frontage under one million dollars has nearly disappeared. As of May 31, 2026, there is one active listing at $500K to $749K waterfront and one active listing at $750K to $999K waterfront.¹ What occasionally appears at lower price points are bluff-top settings with erosion considerations, or condominium units. If you find a waterfront property under $1 million, understand what is driving the price before treating it as a straight opportunity.
What is the practical difference between “waterfront” and “water access” when buying near Lake Michigan?
“Waterfront” means the property boundary meets the lake. “Water access” means some form of access, which might be deeded beach rights, a shared association path, or proximity to public access. The absorption data makes the gap visible: $750K to $999K waterfront at 1.20 months versus $750K to $999K water access at 3.33 months.¹ Buyers pay a meaningful premium for true frontage, and properties with true frontage move faster. Know which type you are targeting before making an offer.
Ready to Buy or Sell on Lake Michigan?
The Lake Michigan shoreline market moves on local knowledge and transaction experience. Connect with the Lake Life Realty team to talk through what is available, what is coming, and what your property is worth in today’s conditions.
Connect with Lake Life Realty